-
Adopt
-
Veterinary Care
Services
Client Information
- What to Expect – Angell Boston
- Client Rights and Responsibilities
- Payments / Financial Assistance
- Pharmacy
- Client Policies
- Our Doctors
- Grief Support / Counseling
- Directions and Parking
- Helpful “How-to” Pet Care
Online Payments
Emergency: Boston
Emergency: Waltham
Poison Control Hotline
-
Programs & Resources
- Careers
-
Donate Now
 By Catherine Sumner, DVM, DACVECC
www.angell.org/emergency
emergency@angell.org
781-902-8400
MSPCA-Angell West, Waltham
Capnography, the measurement and graphical display of carbon dioxide (CO2) concentration in exhaled respiratory gas, was developed in the 1940s. It became part of the standard of care for basic anesthesia monitoring in humans in the 1980s, and has been used in veterinary medicine since the 1990s. It is now recommended as part of the ACVAA Monitoring Guidelines aimed at anesthetized veterinary patients for assessment of appropriate ventilation. Capnometers are available which measure the maximum inspired and expired CO2 concentration, without a graphical display. A more useful device is a capnograph, which creates a continual CO2 waveform: a capnogram. The most common type of capnogram plots CO2 concentration on the y axis versus time on the x axis.
 Capnograph techniques to measure CO2
There are different techniques by which capnographs measure CO2, but infrared absorption is by far the most common. In this method, an LED generates a light beam, which passes through a measuring chamber. CO2 molecules in the chamber absorb light proportionally to the CO2 concentration. A photo detector opposite the LED measures the light intensity reaching it, which is inversely proportional to the concentration of CO2. The measuring device can be located in a nondiverting (mainstream) or diverting (sidestream) position. In a mainstream capnograph, CO2 is measured directly in the breathing system, with an optical chamber inserted between the endotracheal tube and the breathing circuit. With a sidestream system, there is a sampling port and tubing attached to the breathing circuit. Gas that is exhaled by the patient is continuously removed by a suction pump located in the main unit, which is also where the CO2 measurement occurs.
There are advantages and disadvantages to both nondiverting and diverting devices (see Table I).
Table I: Nondiverting vs. Diverting Capnograph Devices
| Advantages | Disadvantages | |
| Nondiverting Device | Real time measurement
No loss of gas volume due to a closed breathing system |
Increased dead space in the breathing circuit
Potential for the weight of the device to result in kinking of the endotracheal tube Condensation of respiratory secretions in the measurement chamber resulting in inaccurate results |
| Diverting Device | A lightweight structure
Less dead space added to the breathing system Fewer issues with condensation affecting results |
A delayed result (usually a few seconds)
Clogging of the sampling line Removal of gas from the breathing circuit (which particularly can be an issue in small patients with small minute ventilations and may need to be accounted for by an increased flow rate) A need to scavenge gas as the samples being removed will usually contain inhalant anesthesia Possible mixing of gas in the sampling line |
Measurement Accuracy
Capnographs are included in many multiparameter monitors available, and overall the measurements are demonstrated to be accurate. Condensation can result in false elevations of CO2 readings of 1.5-2%. Halogenated anesthetic agents, such as isoflurane, can absorb infrared light, also resulting in a false elevation. However, the concentration of anesthetic present is so low that this is considered a negligible effect. High oxygen flow rates can result in sample dilution and thus a false decrease in CO2 readings, particularly in sidestream devices. An ideal oxygen flow rate to avoid this effect in 10-30 ml/kg/min. Finally, in patients with a high respiratory rate, CO2 values may read falsely low due to incomplete alveolar emptying. A study published in JAVMA in 2002 demonstrated that nondiverting capnographs are marginally more accurate, but either a nondiverting or diverting capnograph correlated well with the partial pressure of CO2 in arterial blood (PaCO2) and both devices can be used to trend fluctuations in respiratory status.
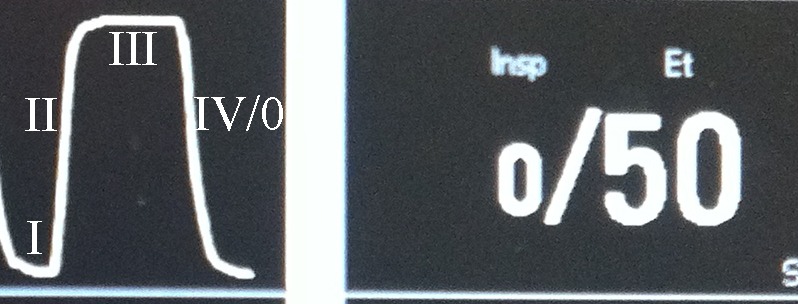
Four Phases of the Waveform
A time capnograph displays CO2 levels during the ventilator cycle, as the amount of CO2 present varies over the course of a normal breath. The waveform generated by a single breath can be divided into 4 phases: 3 associated with expiration and 1 associated with inspiration. Phase I is the expiratory baseline, representing inspired gas, which should have no CO2 present, and early exhalation of CO2 free gas contained in the large conducting airways and breathing circuit. The capnograph during Phase I should read zero. Phase II is the expiratory upstroke, representing exhalation of a steadily increasing proportion of alveolar gas to dead space gas, resulting in a swiftly increasing CO2 value. Phase III is the expiratory plateau, representing exhalation of solely gas from the alveoli. The peak of Phase III is the value that is traditionally referred to at the end tidal CO2 (ETCO2), which is thought to most closely approximate PaCO2. In most patients, the ETCO2 will be 2-5 mmHg less than the PaCO2. The phase that represents inspiration has been referred to as both Phase IV and Phase O, depicting the inspiratory downstroke. As fresh gas that is devoid of CO2 starts to enter the airway the CO2 reading drops rapidly back to the zero baseline.
Analysis of a capnogram can provide a patient’s respiratory rate, the amount of CO2 in inspired air, and the ETCO2 value, which provides information regarding the effectiveness of ventilation. An increased ETCO2 is typically indicative of hypoventilation, due to a decreased respiratory rate or tidal volume. Complete absence of a waveform could be due to apnea, cardiopulmonary arrest, displacement of the endotracheal tube, or an equipment malfunction. Other information can be gleaned from analysis of the waveform. A progressively increasing Phase I over time can be seen with rebreathing, caused by an anesthesia machine issue such as depleted CO2 absorbent or a valve issue, too little fresh gas entering the system, or too short of an expiratory time for the patient. A leak in the anesthesia circuit can be identified via an abbreviated phase III. An obstruction of expiration can be identified by an increased slope to Phase III, and could be due to obstruction of the endotracheal tube, an airway obstruction, bronchospasm, etc.
When to Use Capnography
Capnography can be a helpful tool in patients under anesthesia, ventilator cases, animals suffering from neuromuscular weakness (which can result in hypoventilation and hypercapnea), and head trauma. While it is used most commonly in intubated patients, it can be used in patients that are awake. A study in JAVMA in 2009 demonstrated that a sidestream capnograph attached to a nasal catheter produced ETCO2 values that correlated well with PaCO2 readings. However, the researchers also found that concurrent use of supplemental oxygen resulted in decreased agreement between values. Additionally, there is some value to using a capnograph attached to a facemask in an animal that is awake. Use of this noninvasive monitoring tool can preclude the need to sample arterial blood frequently for measurement of PaCO2 to evaluate ventilatory status. Capnography has also been used to confirm proper endotracheal tube placement: esophageal intubation typically result in a CO2 reading of zero. It can also be used to check feeding tube location: proper placement would result in a CO2 reading of zero. An additional use of capnography is to assess the efficacy of CPCR. In an arrest situation, CO2 readings drop to zero. During CPCR, blood flow to the lungs is created, and CO2 starts to appear in expired gas again. Studies have reported that increasing ETCO2 values achieved during CPCR correlate with successful outcomes (return of spontaneous circulation, or ROSC), with a value <10 mmHg after 20 minutes of CPCR predictive of death in humans.
Capnography is a potentially underutilized monitoring device that is easy to incorporate into daily practice, with a minimal learning curve for use. It is a noninvasive method to evaluate effective ventilation, circulation, and metabolism, which all contribute to CO2 levels.
For more information about Angell’s Emergency/Critical Care service, please visit www.angell.org/emergency or call 781-902-8400.